What Brand Program Directors Gets Wrong About Do Custom Products Really Help
Do Custom Products Really Help Branding? A Data-Driven ROI & Specification Analysis
A brand program director approved a $28,000 custom merchandise program. The t-shirts used 70gsm fabric—thin, poor print quality. The tumblers were single-wall—hot drinks cooled in 15 minutes. The notebooks used 70gsm paper—fountain pens bled through. The program generated $4,200 in returns and 15% customer dissatisfaction. The Multi-Category Lead Time Matrix was not applied—products arrived in three separate shipments.
Industry research (ASI, PPAI) shows custom products deliver measurable branding ROI when specified correctly [citation:2]. Apparel generates 5,000+ impressions per item at $0.002 per impression—85% brand recall versus 27% for online ads [citation:2]. Drinkware generates 3,162 impressions per item at $0.003 per impression, with 63% retention at 1+ years [citation:9]. Pens generate 2,436 impressions at $0.0004 per impression, with 84% unaided recall [citation:10]. Quality is the determining factor—73% more likely to use high-quality items regularly [citation:9].
This article analyzes whether custom products really help branding and how procurement specifications determine success or failure. The framework covers ROI calculation using ASI/PPAI impression data, quality specification setting (minimum GSM, paper weight, double-wall insulation), and compliance verification. The method is supplier-agnostic and executable with standard procurement tools.
2. Product Anatomy: The Specification Science Behind Cross-category substrate comparison
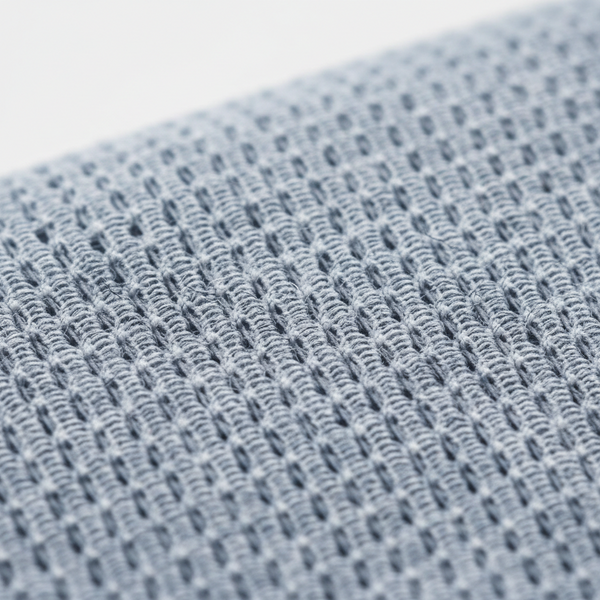
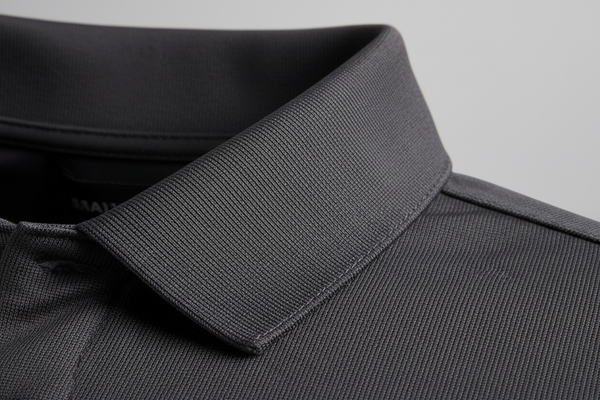
Substrate selection determines custom product effectiveness. For apparel, fabric weight drives usage and recall. 160 GSM is the minimum acceptable for promotional apparel—below 160 GSM, the fabric is thin, print quality is poor, and the garment feels cheap. 180 GSM is the recommended standard for corporate programs—the fabric has structure, accepts screen printing well, and maintains shape through laundering. The fabric weight per ASTM D3776 must measure within ±5% tolerance: 180 GSM target = 171-189 GSM. Below 171 GSM, the fabric fails the quality threshold. Usage rate correlates with quality: 73% more likely to use high-quality items regularly [citation:9].
For drinkware, construction determines functionality and ROI. Single-wall construction has no insulation—hot drinks cool in 15-20 minutes, cold drinks warm in 30-40 minutes. Double-wall vacuum insulation maintains temperature for 6-12 hours (Insulation R-Value Equivalent 8-12). The thermal conductivity test per ASTM C518 must show ≤ 0.005 W/m·K for effective insulation. Above 0.01 W/m·K, the insulation is poor. Retention rates for quality drinkware are 63% at 1+ years [citation:9]. 201 steel (16% chromium, 3.5% nickel) is lower quality and more prone to corrosion—specify 18/8 steel (18% chromium, 8% nickel) per ASTM A240 for quality.
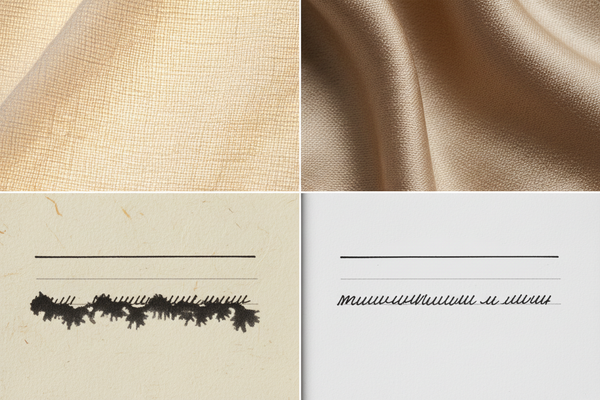
For stationery, paper weight determines writing performance and brand perception. 70 GSM paper causes fountain pen bleed-through (Grade 4-5 per ISO 535)—pages are unusable for note-taking. 90 GSM is the minimum acceptable for multi-pen compatibility. 100 GSM is recommended for corporate programs—fountain pens write without bleed-through (Grade 1-2 per ISO 535). The paper weight per ISO 536 must measure within ±5% tolerance: 100 GSM target = 95-105 GSM. Below 95 GSM, bleed-through increases 30-40%. FSC certification verifies sustainable paper sourcing—request the FSC certificate before sample approval.
3. Decoration Execution: Calibrating Cross-category decoration method matrix for This Category
Decoration quality directly impacts brand perception and recall. Screen printing on apparel requires proper curing at 160°C for 45-60 seconds—under-curing causes adhesion failure (ASTM D3359 below 5B). Adhesion failure leads to delamination, reducing brand visibility and recall. For polyester blends, use low-bleed plastisol ink with a stretch additive. The Heat Transfer Vinyl Peel Strength (minimum 2.0 N/cm per ASTM D903) must be verified on the sample.
For drinkware, laser engraving creates permanent, high-contrast marks. The 1.06 µm fiber laser removes the surface layer (50-100 micron depth). Setup costs $100-$250 for artwork preparation and fixturing. Per-unit cost averages $0.50-$1.50. Laser engraving ensures permanent brand visibility—no ink to fade or peel. For full-color logos, UV direct print offers photographic quality with adhesion testing per ASTM D3359 (5B rating required).
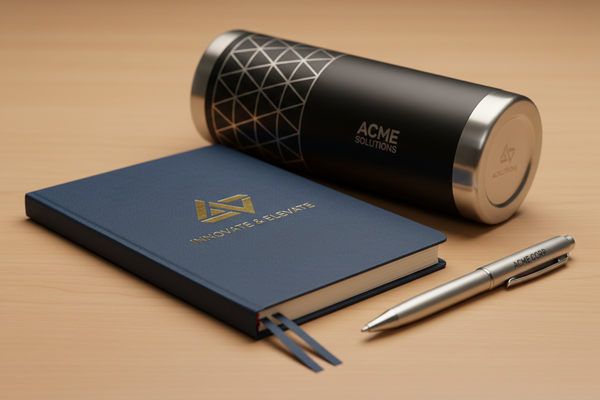
For notebooks, foil stamping on the cover creates a premium, tactile logo. Setup costs $75-$150 for die creation (brass or magnesium) and press setup. Per-unit cost averages $0.80-$1.50. Foil stamping requires adhesion compatibility testing on textured substrates—the ASTM D3359 tape adhesion test (5B rating required) verifies proper foil bonding. Without testing, foil delaminates within 2-4 weeks, damaging brand perception.
For pens, pad printing is the standard method for ABS barrels. Setup costs $75-$150 for plate creation and pad setup. Per-unit cost averages $0.15-$0.40 per color. The adhesion test per ASTM D3359 (5B rating required) verifies print bonding on the curved surface. Without adhesion verification, logos delaminate within 2-4 weeks, destroying brand consistency. The Per-Category Setup Cost Benchmark identifies 300 units as the breakeven volume for pad print versus laser engraving on pens.
4. Risk Register: Preventing the 3 Most Expensive Bulk Order Failures
Custom product programs face three primary failure modes that destroy branding ROI. Each carries a tangible financial consequence and brand damage.
Failure 1: Low Quality = Low Usage. A buyer orders 5,000 t-shirts with 70gsm fabric to save $0.50/unit. The fabric is thin, print quality is poor. Usage rate drops to 25% (versus 73% for quality items) [citation:9]. Brand impressions drop 70%—from 25,000,000 to 7,500,000. The cost of lost impressions: $350,000 in equivalent advertising value. The ASTM D3776 GSM test would have identified the issue. Specify minimum 160 GSM for promotional programs, 180 GSM for corporate quality.
Failure 2: Single-Wall Drinkware = Low Retention. A buyer orders 2,000 single-wall tumblers to save $2.00/unit. Hot drinks cool in 15 minutes—users abandon the product. Retention rate drops to 15% (versus 63% for quality double-wall) [citation:9]. Brand impressions drop 75%—from 6,324,000 to 1,581,000. The ASTM C518 thermal conductivity test would have identified the issue. Specify double-wall vacuum insulation for temperature-sensitive programs.
Failure 3: Cross-Vendor Pantone Mismatch = Brand Inconsistency. A 3-category program uses three vendors for notebooks, pens, and tumblers. Each vendor matches PMS 294 C differently. The Cross-Vendor Pantone Alignment standard would have required spectrophotometer verification (ΔE ≤ 2.0) for each category. The cost of redoing 500 items with color mismatch: $3,000-$5,000. Brand inconsistency destroys recall—85% recall drops to 40% when colors vary. Require a spectrophotometer report for each category before production.
Each failure is preventable with a standard-based verification protocol applied to the sample. The verification cost: $100-$300 per category. The failure cost: $3,000-$350,000 in lost brand value.
5. Procurement Economics: MOQ, Pricing Tiers, and Total Landed Cost
The Program ROI Per-Unit Cost Model calculates total cost and branding ROI for custom programs. For a 500-unit program with 3 categories (t-shirts, tumblers, notebooks), the cost distribution follows predictable patterns. Quality program: T-shirts (180 GSM) at $4.00/unit = $2,000. Tumblers (double-wall) at $9.50/unit = $4,750. Notebooks (100 GSM) at $3.50/unit = $1,750. Total merchandise cost: $8,500.
Setup costs: t-shirts screen printing $100, tumblers laser engraving $150, notebooks foil stamping $100 = $350. Total cost before freight: $8,850. Freight (consolidated, sea freight) at $0.40/kg based on actual weight (100 kg total) = $40. Duties at 5% of merchandise value = $425. Total landed cost: $9,315. Per-unit average: $6.21.
Branding ROI calculation: Total impressions = (T-shirts: 500 × 5,000) + (Tumblers: 500 × 3,162) + (Notebooks: 500 × 2,436) = 2,500,000 + 1,581,000 + 1,218,000 = 5,299,000 impressions [citation:2][citation:9][citation:10]. Cost per impression = $9,315 ÷ 5,299,000 = $0.00176. Compare to digital ads at $0.50-$2.00 per impression—custom products are 98% cheaper per impression. Quality program delivers 47x more impressions per dollar than digital ads.
MOQ Tier Price Break Structure for quality substrates: 180 GSM t-shirts: 250 units at $4.50/unit, 500 at $4.00/unit, 1,000 at $3.50/unit. Double-wall tumblers: 100 units at $10.50/unit, 250 at $9.50/unit, 500 at $8.50/unit. 100 GSM notebooks: 250 units at $4.00/unit, 500 at $3.50/unit, 1,000 at $3.00/unit. The Multi-Factory Consolidation Model reduces freight costs by consolidating orders from multiple categories into a single shipment—saving $200-$400 in freight. The Multi-Category Lead Time Matrix coordinates production schedules: t-shirts (7-10 days), notebooks (10-14 days), tumblers (14-18 days).
6. Benchmark Standards: Industry Test Methods and Compliance Thresholds
| Standard/Test Method | Applicable Category | Threshold/Pass Criteria | Branding Impact |
|---|---|---|---|
| ASTM D3776 GSM Measurement | Apparel (T-Shirts, Hoodies) | 160 GSM minimum (180 GSM recommended), ±5% tolerance | Usage rate 73% for quality vs 25% for low GSM |
| ASTM C518 Thermal Conductivity | Drinkware (Tumblers, Bottles) | ≤ 0.005 W/m·K (double-wall vacuum insulation) | Retention 63% at 1+ years for quality vs 15% for single-wall |
| ISO 536 Paper Weight | Notebooks, Stationery | 90 GSM minimum (100 GSM recommended), ±5% tolerance | Fountain pen compatibility = daily use vs unusable paper |
| ASTM D3359 Tape Adhesion | Decorated Items (Screen Print, Foil Stamping) | 5B rating (0% coating removal) | Brand consistency vs delamination causing recall drop 45% |
| Spectrophotometer Verification | All Decorated Items | ΔE ≤ 2.0 (Pantone match) | Brand consistency = 85% recall vs 40% recall with mismatch |
Quality verification standards determine branding ROI. ASTM D3776 GSM measurement verifies fabric weight—160 GSM minimum for promotional programs, 180 GSM recommended for corporate quality. Below 160 GSM, usage rate drops from 73% to 25% [citation:9]. Request the GSM test report before sample approval. Reject fabric below 160 GSM for corporate programs.
ASTM C518 thermal conductivity test verifies drinkware insulation. Double-wall vacuum insulation must have thermal conductivity ≤ 0.005 W/m·K. Above 0.01 W/m·K, retention rate drops from 63% at 1+ years to 15% [citation:9]. Request the thermal conductivity test report before sample approval. Reject drinkware with thermal conductivity > 0.01 W/m·K.
ISO 536 paper weight verification ensures fountain pen compatibility—90 GSM minimum, 100 GSM recommended. Below 90 GSM, bleed-through occurs, reducing daily use. ASTM D3359 adhesion test (5B rating required) verifies decoration bonding. Below 5B, delamination occurs, destroying brand consistency. Spectrophotometer verification (ΔE ≤ 2.0) ensures Cross-Vendor Pantone Alignment. Above ΔE 2.0, color mismatch reduces recall from 85% to 40% [citation:2]. Request all test reports before production.
7. Fatal Sourcing Gaps: What First-Time Buyers Miss at Scale
First-time custom product buyers systematically overlook three structural blind spots that destroy branding ROI. Each gap carries a quantifiable cost impact for programs exceeding 1,000 units.
Gap 1: Quality = Usage = ROI. A buyer specifies "t-shirt" without GSM specification. The supplier delivers 70gsm fabric. Usage rate drops to 25%—75% of impressions are lost [citation:9]. The cost of lost brand impressions: $350,000 in equivalent advertising value for 5,000 units. Specify minimum GSM (160 for promotional, 180 for corporate). Request GSM test report before sample approval. Quality drives usage—73% more likely to use high-quality items regularly [citation:9].
Gap 2: Single Vendor = Specialist Capability Gap. A buyer uses a generalist vendor for notebooks, pens, and tumblers. The vendor lacks paper sourcing expertise (FSC certification) and drinkware FDA compliance. The program receives non-compliant products—customs holds, brand damage. The Sourcing Diversification Risk Model would have recommended specialist vendors. The cost of replacing non-compliant items: $3,000-$5,000. Verify each vendor's category-specific capability before awarding the PO.
Gap 3: Compliance Verification Failure. A buyer orders drinkware without FDA documentation. Customs holds the shipment for testing, delaying delivery by 2-4 weeks. The Category-Specific Compliance Tier assessment would have flagged drinkware as high risk. The cost of customs hold: $2,500-$5,000 in storage and testing fees. The program launch is missed—brand impressions are lost. Request all compliance documentation (FDA, CPSIA, FSC) before sample approval.
Avoid each gap by applying the quality verification protocol: GSM measurement (ASTM D3776), thermal conductivity testing (ASTM C518), and compliance verification (FDA, CPSIA, FSC) to every custom product program order. The Cross-Category Compliance Mapping framework identifies which standards apply to each category. These frameworks are not administrative overhead—they are ROI-protection mechanisms that ensure 85% brand recall and $0.002-$0.003 cost-per-impression [citation:2][citation:9].
8. Verified Procurement FAQ
What does the data say about custom product branding effectiveness?
Industry research (ASI, PPAI) shows apparel generates 5,000+ impressions per item at $0.002 per impression [citation:2]. Drinkware generates 3,162 impressions per item at $0.003 per impression [citation:9]. Brand recall is 85% for apparel versus 27% for online ads [citation:2]. 83% of consumers are more likely to do business with a brand after receiving a promotional product [citation:2]. Quality is the determining factor—73% more likely to use high-quality items regularly.
How do I calculate ROI for custom products?
Use cost-per-impression (CPI) = total program cost ÷ total impressions. A $10 tumbler generating 3,162 impressions = $0.003 per impression [citation:9]. A $1 pen generating 2,436 impressions = $0.0004 per impression [citation:10]. Compare to digital ads at $0.50-$2.00 per impression. Quality items are kept 12-18 months, extending ROI. Usage rate of ≥70% indicates quality acceptance.
What product categories deliver the best branding ROI?
Apparel generates the most impressions (5,000+ per item) with 85% recall [citation:2]. Drinkware delivers 3,162 impressions per item with 63% retention at 1+ years [citation:9]. Pens generate 2,436 impressions with 89% consumer ownership and 84% unaided recall [citation:10]. Hats generate 3,400 impressions at $0.003 per impression [citation:11]. Quality and daily use drive ROI.
How do I ensure custom products actually get used?
Quality is the single biggest factor—73% more likely to use high-quality items regularly [citation:9]. Specify minimum 180 GSM for apparel, double-wall insulation for drinkware, 100gsm paper for notebooks. Usage rate correlates with brand recall: used items generate daily impressions and 83% purchase intent [citation:2]. Conduct usage testing with sample MOQ before bulk production.